SQL in Action: Cleaning and Analysing Nashville Housing Data
0. Collecting and Importing the Data
To start, I downloaded the dataset in CSV format from this link. I then transformed the CSV file into a suitable format (e.g., Excel) and imported it into SSMS.
1. Data Understanding and Exploration
To gain a deeper understanding of the dataset, I examined the structure and data types of the columns using the following SQL query:
The data consists of 19 columns and 56,477 rows, each representing specific attributes of the properties:
2. Data Cleaning and Preprocessing
During the initial exploration, several data quality issues were identified and resolved to ensure accurate analysis:
3. Data Visualisation
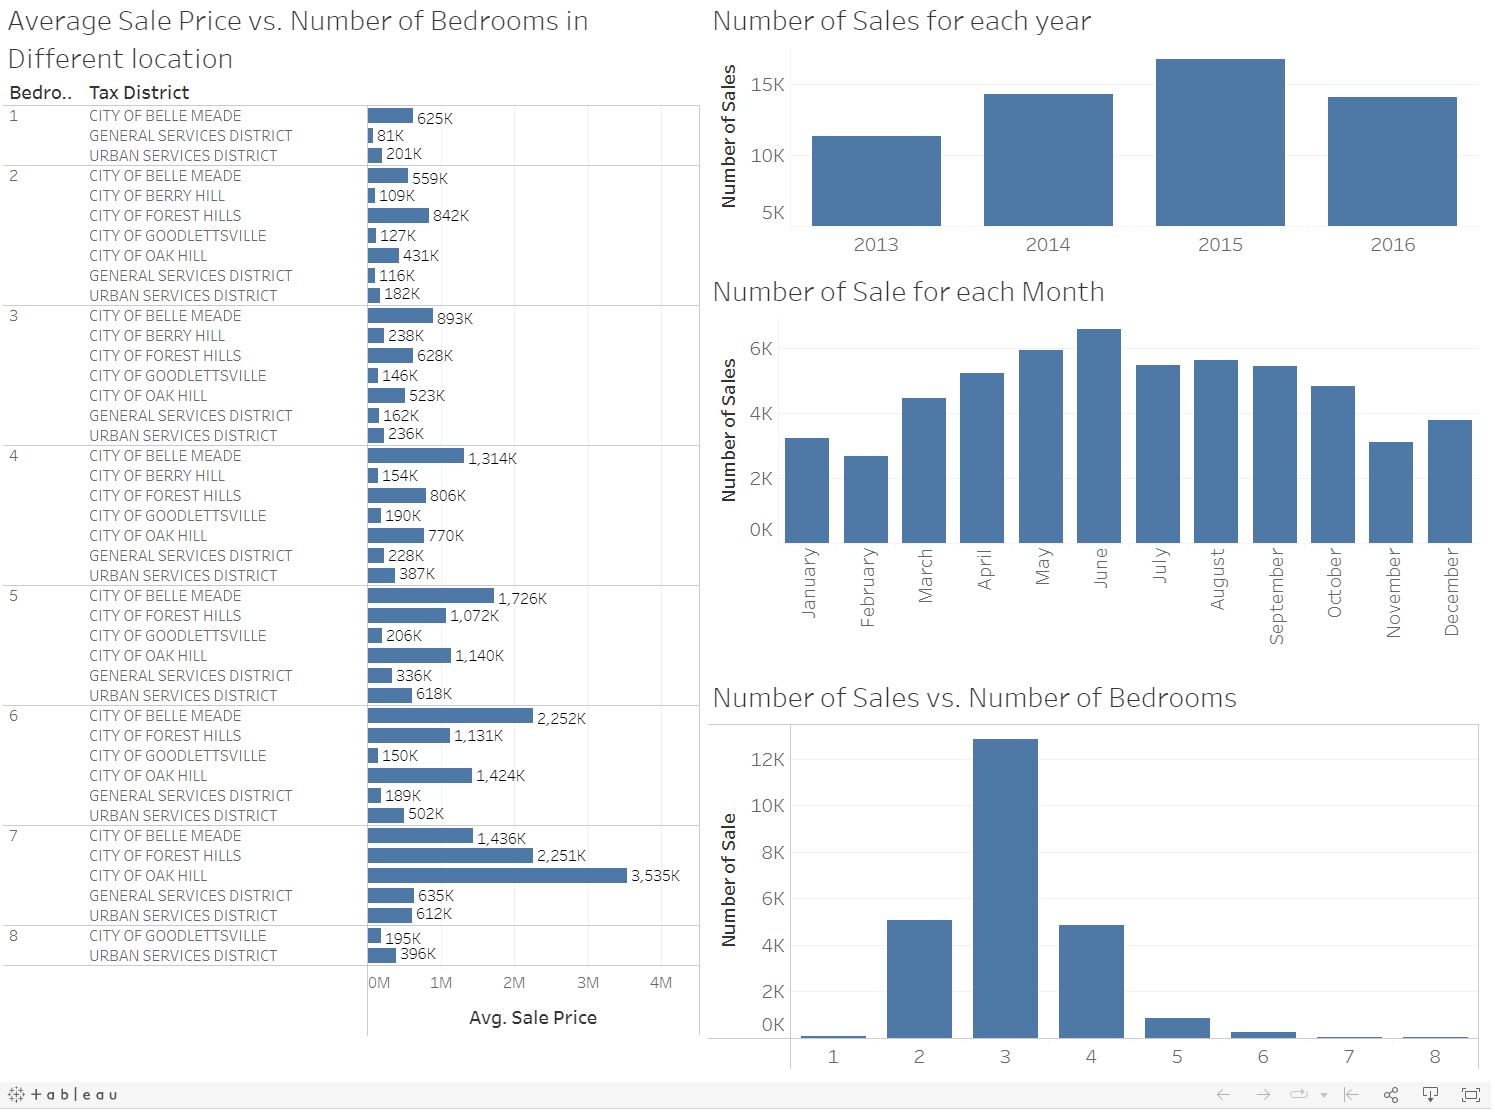
After extracting the relevant data using SQL queries, I loaded the processed data into Tableau for data visualisation. Tableau offers powerful visualisation capabilities that allow for interactive exploration and presentation of the data. Moving forward, with the refined dataset in Tableau, I will delve into data analysis and visualisation to derive meaningful insights. By leveraging various Tableau features and visualisations, such as charts, graphs, and interactive dashboards, I will present the findings in a visually appealing and easily understandable manner. Several visualisations that are explored include:
- Relationship between Average Sale Price and number of bedrooms for each District: This visualisation examines the relationship between the average sale price of properties and the number of bedrooms in each district of Nashville. By using a bar chart, we can assess if there is a correlation between the number of bedrooms and the sale price. This analysis provides insights into the housing market's pricing dynamics based on the number of bedrooms in different districts.
- Number of sales vs. number of bedrooms: This visualisation presents a comparison of the number of property sales against the number of bedrooms. It showcases the distribution of sales across various bedroom configurations, such as 1-bedroom, 2-bedroom, etc. This analysis helps identify popular bedroom configurations and their corresponding sales volumes, providing insights into buyer preferences and market demand.
- Number of sales for each year: This visualisation depicts the number of property sales recorded for each year in Nashville. It was presented as a bar chart, allowing us to observe trends and patterns over time. By analyzing the sales volumes over the years, we can identify growth trends, seasonal variations, or any significant changes in the Nashville housing market.
- Number of sales for each month: This visualisation displays the number of property sales recorded for each month of the year. It was represented as a bar chart, enabling us to identify monthly fluctuations and seasonality in the housing market. Analyzing sales patterns by month provides insights into the temporal dynamics of the Nashville housing market, helping identify peak months or periods of high sales activity.

The dashboard can be accessed on my Tableau Public Profile via this link.
4. Conclusion
By implementing these analyses and visualisations, we can gain valuable insights into the Nashville housing market, including price trends, land use patterns, property value dynamics, and more. The Tableau platform offers the flexibility to explore and present these insights effectively, allowing stakeholders to make data-driven decisions in the real estate sector.